

Compare profitability across jobs
Job profitability puts every job side by side: what it’s worth, how much you’ve billed, what it has cost and the margin left. The chart shows at a glance which jobs are under-billed or eating their margin. The figures are the same ones each job’s Costing tab shows.
- Open the report — Go to Reports and choose Job profitability under Jobs.
- Choose which jobs — Under Jobs, pick Active and on hold (the default), Active, On hold, Completed or All. The chart and the table both follow it.
- Read the cards — The number of Jobs, total Contract value, Billed to date (with its share of contract value) and Margin (with its share of revenue).
- Read the chart — “Contract, billed and cost by job” shows three bars per job: Contract value, Billed to date and Cost, largest contract first, for up to 10 jobs. A marker on the cost bar shows the job’s budget. Hover over or focus a job to see its figures, such as “Budget 32,000.00 · 78% used”.
- Read the table — Every job with Job, Status, Contract value, Billed to date, Billed %, Budget used, Revenue, Cost, Margin and Margin %, with a Total row.
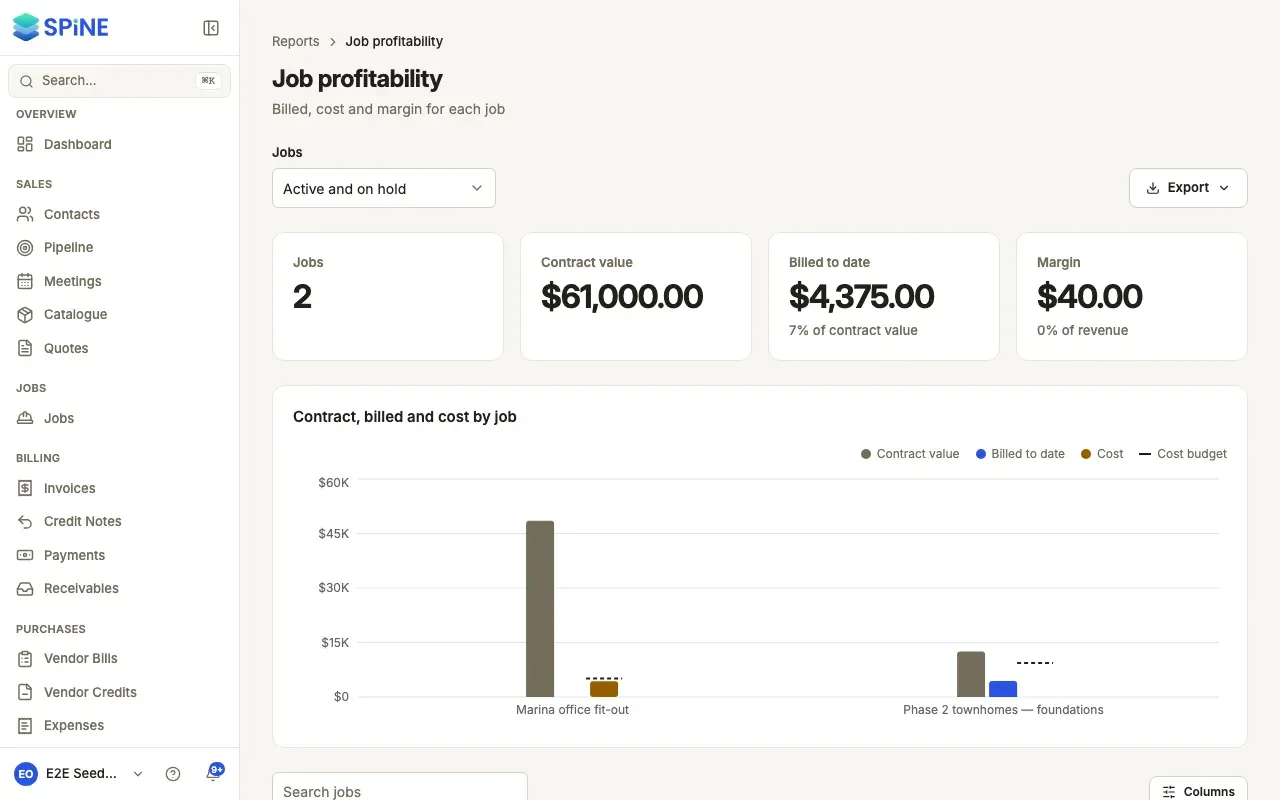
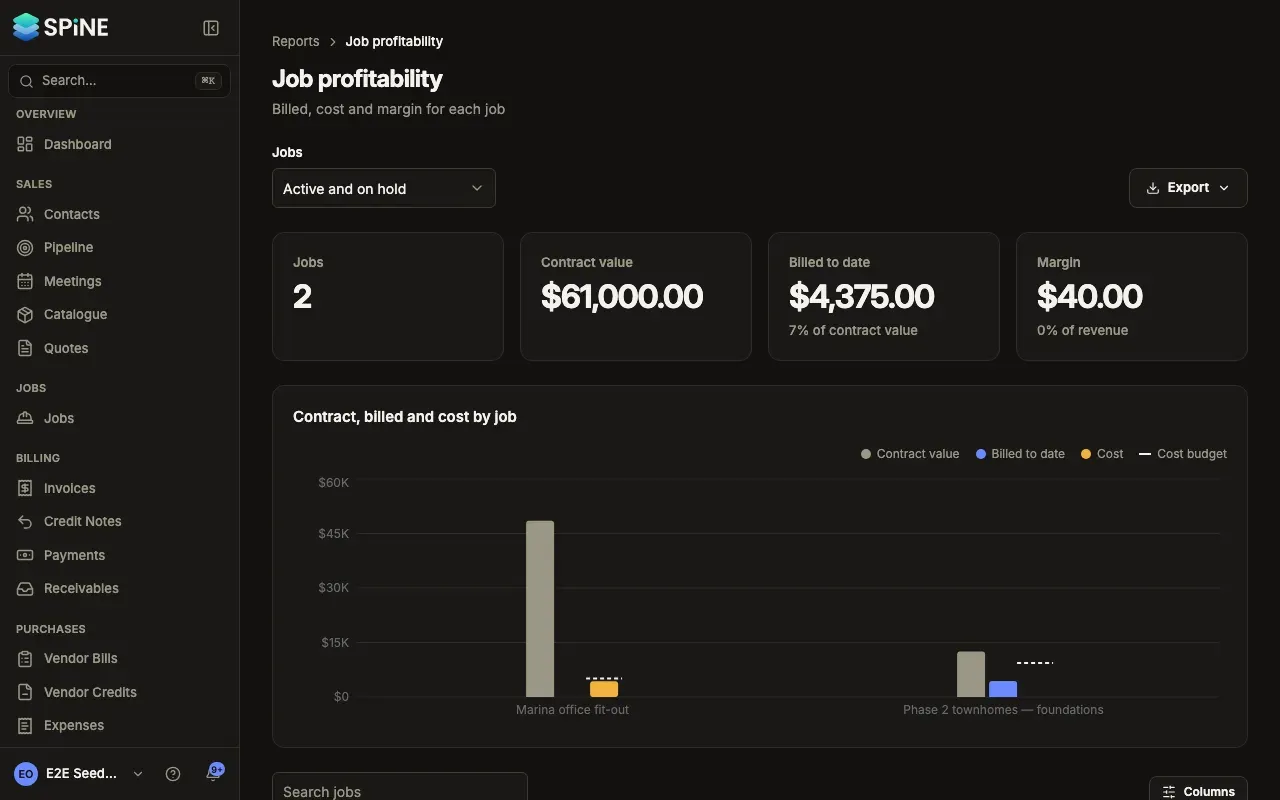
When there are more than 10 jobs, the chart says “Showing 10 of n jobs — the table lists them all.” Use Search jobs to find one in the table.
A negative margin shows in red with a minus sign, so you can tell it apart without relying on colour.
Where the figures come from
Section titled “Where the figures come from”Revenue and cost come from your books, and billed to date from issued invoices: the same figures as each job’s Costing tab. To dig into one job, open it from Jobs.
The dashboard’s Job profitability and Jobs in progress cards draw on the same figures.
Last updated with Spine 1.0.0-beta.2