

See where cash came from and went
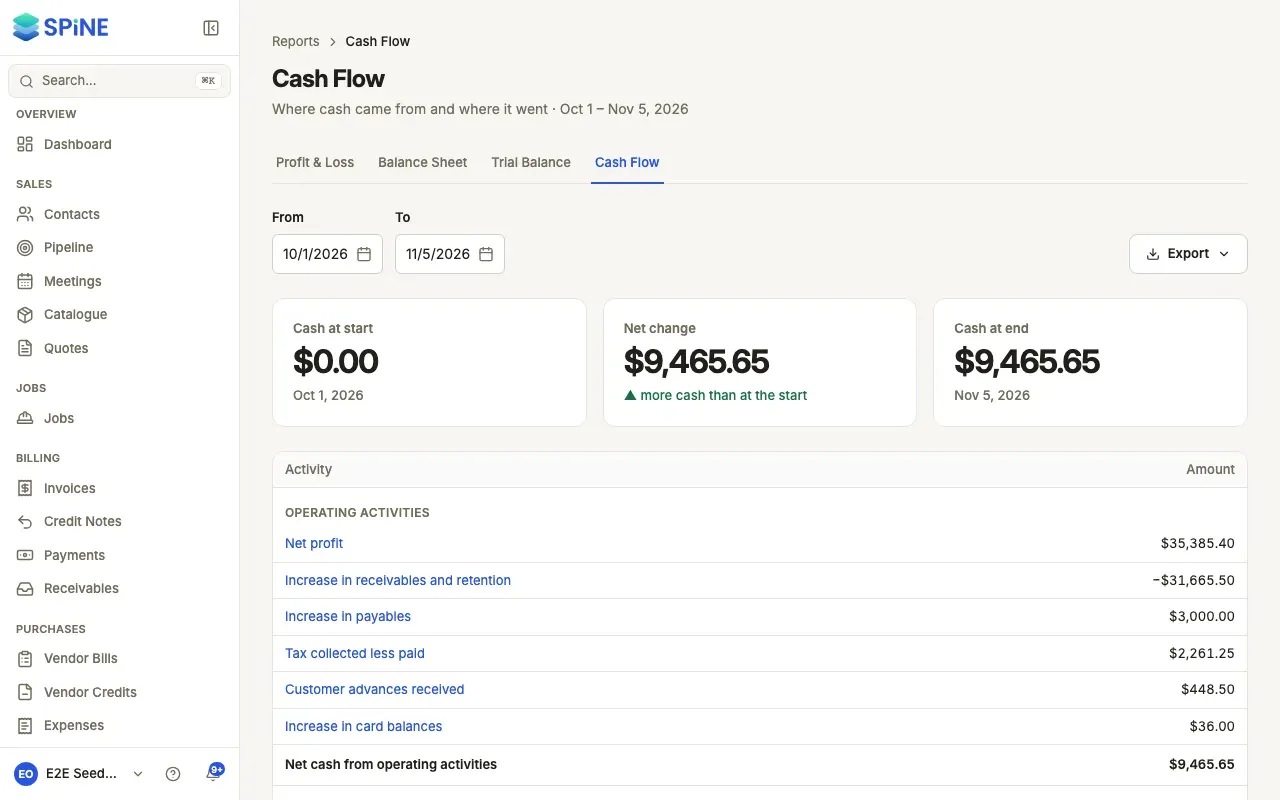
You can make a profit and still have less cash at the end of the month: customers haven’t paid yet, you bought equipment, or you paid back a loan. The Cash Flow report starts from your cash at the beginning of the period and shows what moved it.
- Open the report — Go to Reports › Cash Flow, or use the tabs from Profit & Loss.
- Set the range — Choose From and To.
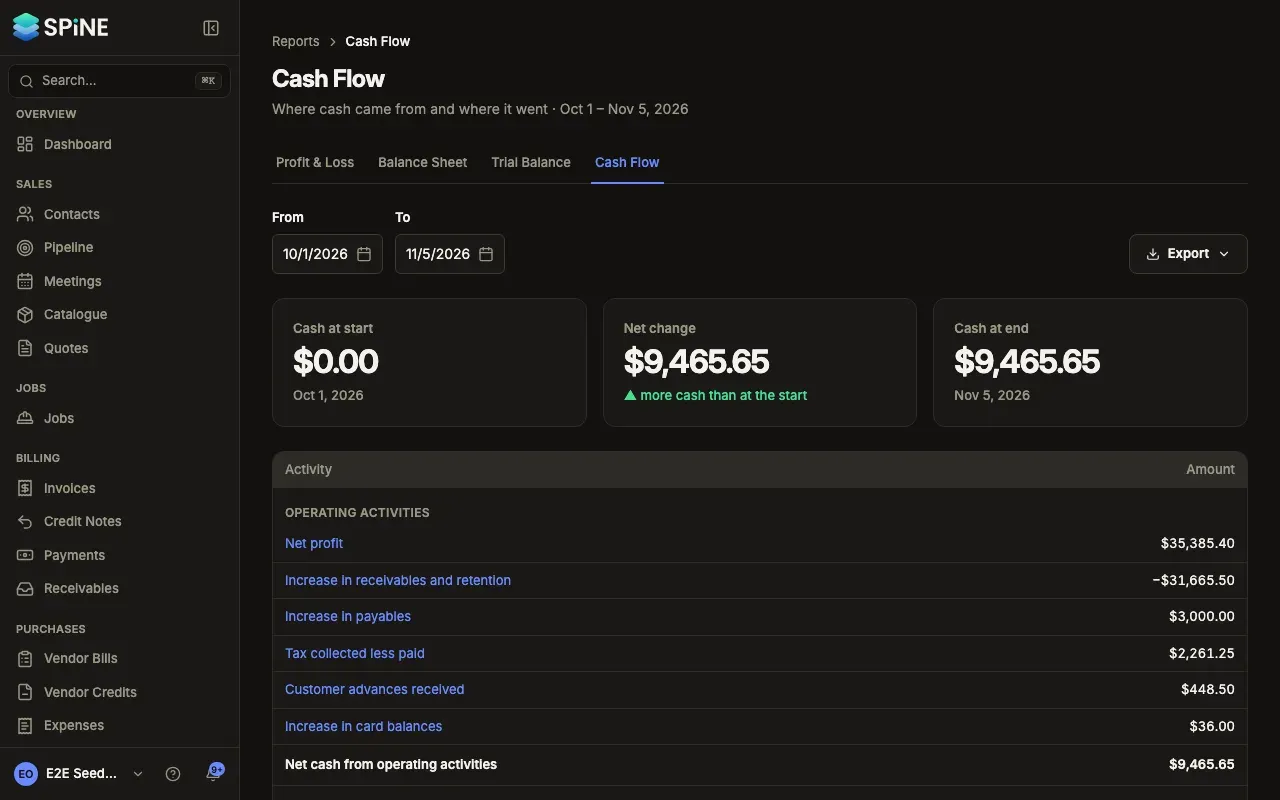
- Read the cards — Cash at start, Net change (with “▲ more cash than at the start” or “▼ less cash than at the start”) and Cash at end.
- Read the sections — Operating activities: net profit adjusted for changes in what customers owe you, what you owe vendors, tax and advances. Investing activities: fixed assets. Financing activities: capital, drawings and loans. Then Net change in cash and Cash at end.
- Click a line — See the accounts behind it. A positive amount brought cash in.
It ties to your accounts
Section titled “It ties to your accounts”Cash at end equals the total of every bank and cash account on the To date. The footnote confirms it: “Cash at end equals the total of your bank and cash accounts”. Card accounts are liabilities, not cash, so they’re not included.
To export, press Export (see Export or print a report).
Last updated with Spine 1.0.0-beta.2